Campbell River Real Estate Market Stats
October 2021 Real Estate Market Statistics
CAMPBELL RIVER Single Family Homes $755,543 BENCHMARK PRICE 5% FROM ONE MONTH AGO 38% FROM ONE YEAR AGO 50 SINGLE FAMILY HOME SALES from 46 ONE MONTH AGO from 66 ONE YEAR AGO PLEASE NOTE: Single family property does NOT INCLUDE acreage with house, condominiums, duplex/triplex, mobile homes/on pad, single family waterfront or single family strata. CAMPBELL RIVER Townhomes…
Read MoreSeptember 2021 Real Estate Statistics
CAMPBELL RIVER Single Family Homes $648,186 BENCHMARK PRICE 2% FROM ONE MONTH AGO 24% FROM ONE YEAR AGO 46 SINGLE FAMILY HOME SALES from 55 ONE MONTH AGO from 64 ONE YEAR AGO PLEASE NOTE: Single family property does NOT INCLUDE acreage with house, condominiums, duplex/triplex, mobile homes/on pad, single family waterfront or single family strata. CAMPBELL RIVER Townhomes…
Read MoreMarket Update & Fall Predictions 2021
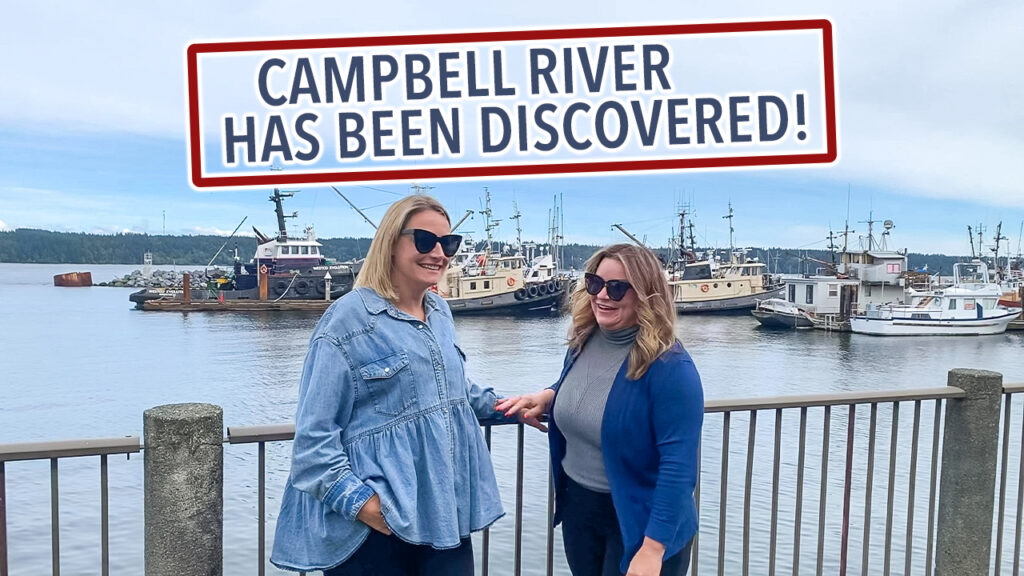
In spirits of it officially being Fall, we have brought some mind blowing stats AND our predictions for the Campbell River real estate market this fall. It’s safe to say Campbell River has been discovered and is now a destination to stay. “I think we are going to be seeing prices still increasing, with having…
Read MoreJune 2021 Real Estate Statistics
CAMPBELL RIVER Single Family Homes $611,695 BENCHMARK PRICE 3% FROM ONE MONTH AGO 22% FROM ONE YEAR AGO 63 SINGLE FAMILY HOME SALES from 59 ONE MONTH AGO from 49 ONE YEAR AGO PLEASE NOTE: Single family property does NOT INCLUDE acreage with house, condominiums, duplex/triplex, mobile homes/on pad, single family waterfront or single family strata. CAMPBELL RIVER Townhomes…
Read MoreMay 2021 Real Estate Statistics
CAMPBELL RIVER Single Family Homes $594,868 BENCHMARK PRICE 2% FROM ONE MONTH AGO 19% FROM ONE YEAR AGO 54 SINGLE FAMILY HOME SALES from 19 ONE YEAR AGO PLEASE NOTE: Single family property does NOT INCLUDE acreage with house, condominiums, duplex/triplex, mobile homes/on pad, single family waterfront or single family strata. CAMPBELL RIVER Townhomes $433,841 BENCHMARK PRICE 2%…
Read MoreApril 2021 Real Estate Statistics
CAMPBELL RIVER Single Family Homes $583,197 BENCHMARK PRICE 3% FROM ONE MONTH AGO 18% FROM ONE YEAR AGO PLEASE NOTE: Single family property does NOT INCLUDE acreage with house, condominiums, duplex/triplex, mobile homes/on pad, single family waterfront or single family strata. CAMPBELL RIVER Townhomes $426,857 BENCHMARK PRICE 5% FROM ONE MONTH AGO 24% FROM ONE YEAR AGO…
Read MoreJanuary 2021 Real Estate Market Statistics
CAMPBELL RIVER Single Family Homes $561,000 MEDIAN PRICE What is Median Sales Price? Expand The median sell price is a better indicator of the price that’s truly in the middle of any given market. This is because the median price is not skewed by anomalies or exceptional properties in a market that could sell…
Read More2020 Stats & 2021 Predictions
We wanted to recap the unexpected 2020 and let you know what we think 2021 will bring the Campbell River Real Estate Market! We saw an increase across all property types and expect that trend to continue through 2021. We recommend all buyers to put a 120 day hold on their rate and be ready…
Read MoreDecember 2020 Year to Date Real Estate Statistics
CAMPBELL RIVER Single Family Homes $537,768 AVERAGE SALES PRICE YEAR TO DATE What is Average Sales Price? Expand The average sales price is determined by taking the total value of properties sold in a given timeframe and dividing that by the number of properties sold. $518,000 MEDIAN SALES PRICE YEAR TO DATE What…
Read MoreNovember 2020 Real Estate Statistics
CAMPBELL RIVER Single Family Homes $475,900 BENCHMARK PRICE -2% FROM ONE MONTH AGO 8% FROM ONE YEAR AGO 45 SINGLE FAMILY HOME SALES from 66 ONE MONTH AGO from 32 ONE YEAR AGO PLEASE NOTE: Single family property does NOT INCLUDE acreage with house, condominiums, duplex/triplex, mobile homes/on pad, single family waterfront or single family strata. CAMPBELL RIVER Townhomes…
Read More